Profiler
The Profiler measures how often a React application renders and what the “cost” of rendering is. Its purpose is to help identify parts of an application that are slow so that we can work on optimizing them.
Lets take a look at one example. Assuming that we are developing a Reports Dashboard component for one of the leading bank in the market.
This Reports Dashboard Component will be using multiple components in it. They are
1. NewAccountsReports
2. LoansRepaymentReports
3. CreditCardsReports
Assuming that we have developed all these components and our ReportsDashboard Component is ready. We can perform various operations on these reports like entering some inputs to generate reports, triggering few events.
We have discussed in our previous videos that our components gets re-rendered for various operations we perform on these components. Assuming that for some reason the ReportsDashboard Component is not very responsive.
Now we have to identify which component is getting re-rendered how many times and the amount of time it is taking for re-rendering the Tree. so that it will help us to fix the Problem.
This is where we will make use of Profiler in React.
Lets open index.js file from our demo-project. We will create three different components. They are NewAccountsReports, LoanRepaymentReports and ReportsDashboard Component Classes.
ReportsDashboard Component Class will be calling both the Components.
I have the Code handy and I am pasting it here.
class NewAccountReports extends React.Component{

  constructor(props){

    super(props);

    this.state={

      FromDate:'',

      ToDate:''

    };

  }


  handleChange=e=>{

    let name=e.target.name;

    let value=e.target.value;

    this.setState({

      [name]:value

    });

  }

  render(){

    return(

      <div>

        <h2>Welcome to New Accounts Reports Component...</h2>

        <p>

          <label>From Date : <input type="text" name="FromDate"

          onChange={this.handleChange} value={this.state.FromDate}></input></label>

        </p>

        <p>

          <label>To Date : <input type="text" name="ToDate"

          onChange={this.handleChange} value={this.state.ToDate}></input></label>

        </p>

        <input type="submit" value="Generate"></input>

      </div>

    )

  }

}


class LoansRepaymentReports extends React.Component{

  constructor(props){

    super(props);

  }


  render(){

    return(

      <div>

        <h2>Welcome to Loans Repayment Reports Component...</h2>

      </div>

    );

  }

}


class ReportsDashboard extends React.Component{

  constructor(props){

    super(props);

  }


  render(){

    return (

      <React.Fragment>

        <h2>Welcome to Reports Dashboard...</h2>

        <NewAccountReports></NewAccountReports>

        <LoansRepaymentReports></LoansRepaymentReports>

      </React.Fragment>

    );

  }

}

const element=<ReportsDashboard></ReportsDashboard>

ReactDOM.render(element,document.getElementById("root"));
Lets save these changes, navigate to the browser and we can see the Output. As we perform various operations on these components, the components will be getting re-rendered. We want to Log all the details of how many times the respective component is getting re-rendered, how much time each update is taking, when is the start time and when is the commit time.
This is where we will make use of Profile in react. Lets see how do we do that.
A Profiler can be added anywhere in a React tree to measure the cost of rendering that part of the tree. It requires two props: an id (string) and an onRender callback (function) which React calls any time a component within the tree “commits” an update.
Now lets go and add the Profiler to our NewAccountsReports Component. Lets add two attributes. One is Id, Using Id we will track each profiler. And the other attribute is onRender and to this lets pass the function name
<Profiler id="newAccounts" onRender={this.callbackFunction}>

          <NewAccountReports></NewAccountReports>

</Profiler>
React calls this callbackFunction any time a component within the profiled tree “commits” an update.
Lets go ahead and implement this callbackFunction. It receives parameters describing what was rendered and how long it took.
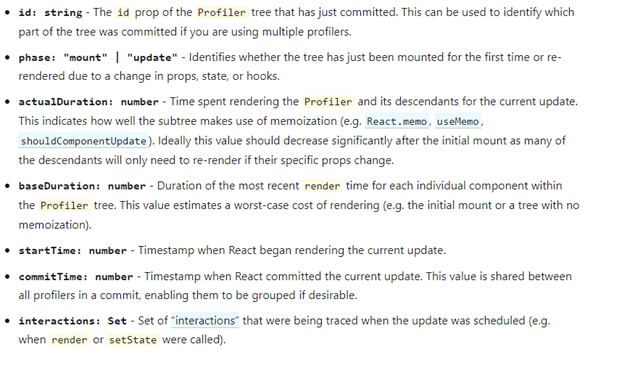
We can log these parameter values to our console.
callbackFunction=(id,phase,actualDuration,baseDuration, startTime,

    commitTime, interaction)=>{

      console.log('Id is : '+id+', Phase is : '+phase);

      console.log('Actual Duration is : '+actualDuration+' and Base Duration is :'+

      baseDuration);

  }
Lets save these changes. Navigate to the browser. Open developer tools, we can find one set of logs in the console. That is the result of first Render and this phase is called as Mount. We can enter From Date value and we can see the logs again. This is the result of re-render. This phase is called as Update.
Multiple Profiler components can be used to measure different parts of an application.
We can apply the same Profiling for LoansRepaymentReports Component as well.
Profiler components can also be nested to measure different components within the same subtree.
Although Profiler is a light-weight component, it should be used only when necessary; each use adds some CPU and memory overhead to an application.
Profiling adds some additional overhead, so it is disabled in the production build.
To opt into production profiling, React provides a special production build with profiling enabled. Read more about how to use this build at fb.me/react-profiling
Video Reference:


© 2020 Pragimtech. All Rights Reserved.